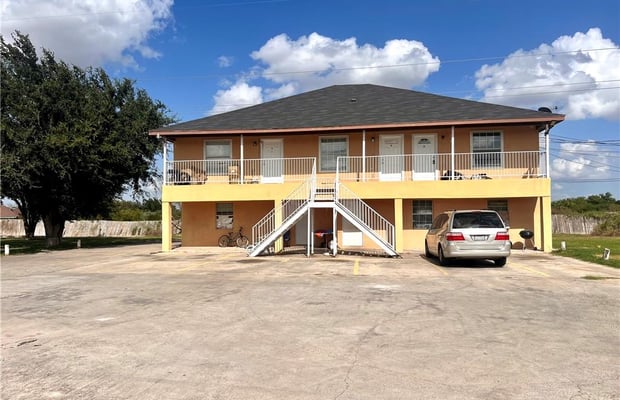
 1 / 2
7-Unit Multifamily in Mission, TX
Hidalgo County, TX · listed Aug 17, 2024 (802 days)
- $/unit
- $48,571
- ▼ 47% vs TX · 12th pct
- Cap rate
- —
- Gross yield
- 11.7%
- Units
- 7
- 1 bldg · 2005
Financials
- Asking price
- $340,000
- Price per unit
- $48,571
- Price per sq ft
- $73
- Gross rent / year
- $39,900
- Net operating income
- Not stated
- NOI per unit
- Not stated
- Cap rate
- Not stated
- Gross yield
- 11.7%gross rent ÷ price
- Occupancy
- Not stated
As stated by the seller. Verify during due diligence.
Building
- Units
- 7
- Unit mix
- 5 units that are 2-bedroom, 2-bath and 2 units are 1-bedroom and 1-bath
- Buildings
- 1
- Year built
- 2005
- Building size
- 4,652 sq ft
- Avg unit size
- 665 sq ft
- Lot size
- Not stated
- Condition
- Value-add
Deal terms
- Owner financing
- Not stated
Listing
- Listed
- Aug 17, 2024
- Days on market
- 802 days
- On MultifamilyRadar
- Oct 28, 2026
- Last price change
- Not stated
- Location
- Approximate (~0.5 mi)
- Listing #
- 1752
About this property
Excellent value-add multifamily opportunity in Mission, TX! This 7-unit property offers immediate income potential with room to increase returns through strategic improvements. The asset features a functional layout, ample on-site parking, and a spacious lot with flexibility for future enhancements. Investors will appreciate the opportunity to boost revenue through interior updates, improved tenant amenities, and operational efficiencies. The property lends itself well to adding features such as a shared laundry facility, covered parking or carports, and enhanced outdoor common areas like shaded seating or grilling spaces to support rent growth and retention. The lot also offers potential to expand or reconfigure parking, increasing overall usability and appeal. Conveniently located near schools, retail, and major roadways, this property is well-positioned for strong cash flow and long-term appreciation.
Location
Approximate area. The exact address is shared on request.
Similar buildings nearby
| Property | Price | $/unit$/unit vs median | Cap |
|---|---|---|---|
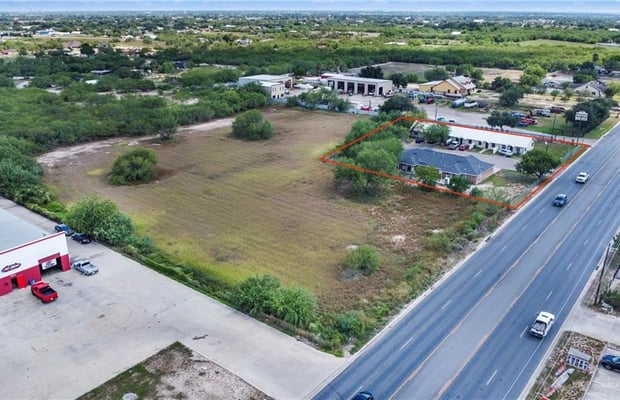 Mission, TX ▼ 6% cut | $515K | $57K$57K | — |
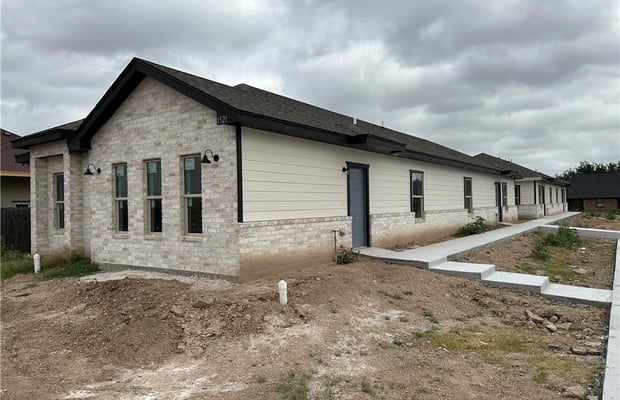 Mission, TX Stabilized | $549K | $78K$78K | — |
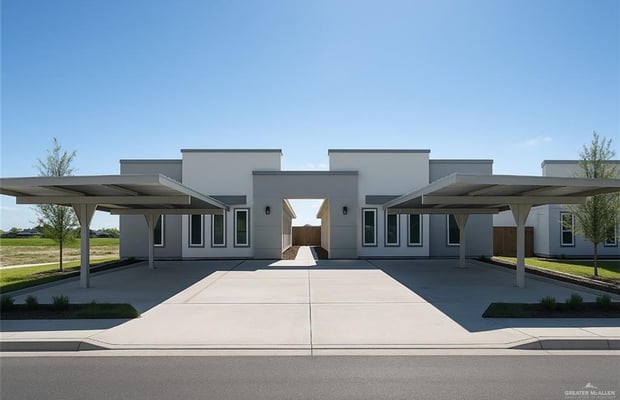 Alton, TX | $565K | $113K$113K | — |
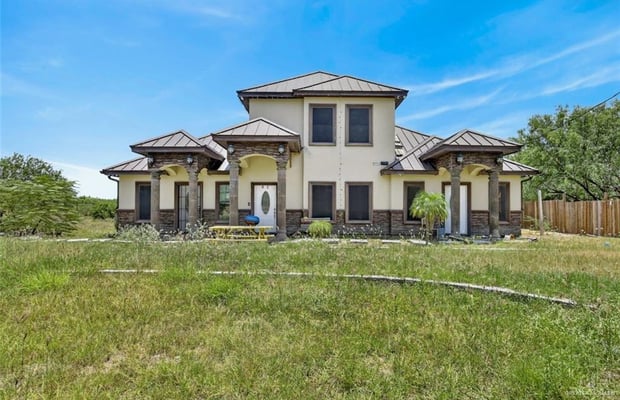 Mission, TX ▼ 5% cut | $350K | $44K$44K | — |
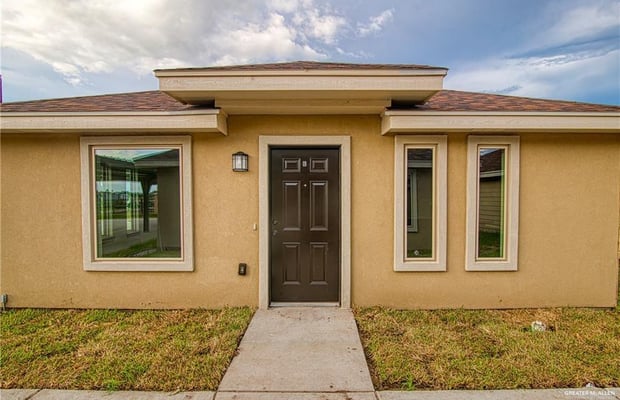 Mission, TX Stabilized | $650K | $108K$108K | 6% |
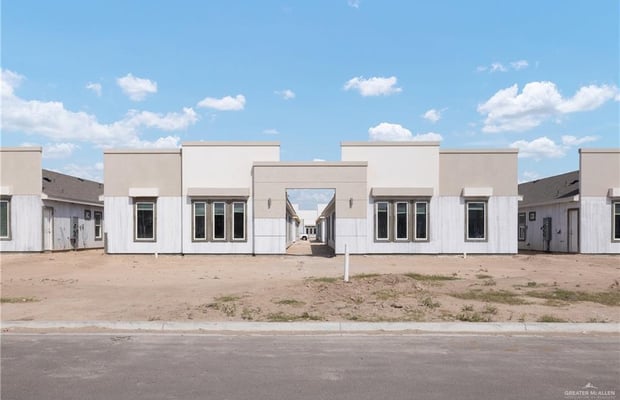 Alton, TX New construction | $565K | $113K$113K | — |