 1 / 2
▼ 17% cutHigh yieldValue-add
$685,000
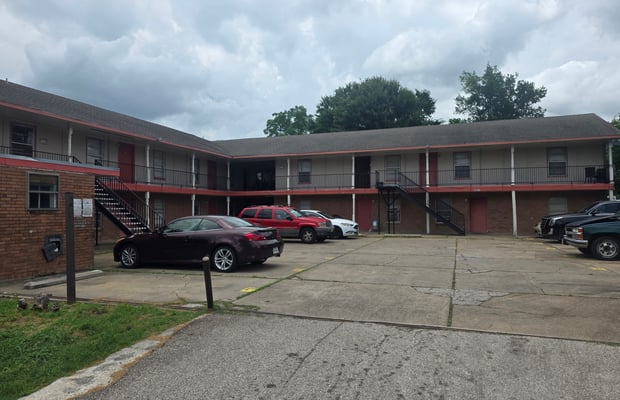
12-Unit Multifamily in Houston, TX
Harris County, TX · listed Apr 14, 2026 (196 days)
▼ Reduced 17% on Sep 28, 2026, was $825,000
Price per unit compared
This property$57K
Within ~40 mi (275)$99K
Texas median (1,196)$92K
- $/unit
- $57,083
- ▼ 38% vs TX · 19th pct
- Cap rate
- 13.9%
- ▲ 6.5 pts vs TX median
- NOI
- $95K
- $7,935/unit/yr
- Units
- 12
- 2 bldg · 1964
Financials
- Asking price
- $685,000
- Price per unit
- $57,083
- Price per sq ft
- $71
- Gross rent / year
- Not stated
- Net operating income
- $95,216
- NOI per unit
- $7,935
- Cap rate
- 13.9%
- Gross yield
- Not stated
- Occupancy
- 97%
As stated by the seller. Verify during due diligence.
Building
- Units
- 12
- Unit mix
- Not stated
- Buildings
- 2
- Year built
- 1964
- Building size
- 9,606 sq ft
- Avg unit size
- 801 sq ft
- Lot size
- Not stated
- Condition
- Value-add
Deal terms
- Owner financing
- Not stated
Listing
- Listed
- Apr 14, 2026
- Days on market
- 196 days
- On MultifamilyRadar
- Oct 28, 2026
- Last price change
- Sep 28, 2026: $825K → $685K
- Location
- Approximate (~0.5 mi)
- Listing #
- 1244
About this property
Next steps:
5-10 year proforma with rent growth.
Include capital expenditure/renovation plan to justify rent increases.
Optional refinance scenario after stabilization for equity capture.
97% Leased
Highlights
Current rents for 2BR are -46% below market, 1BR -31% below market.
Stabilization assumes occupancy remains at 97%.
Management fee estimated at 10% of EGI
Taxes and insurance kept constant.
Vacancy allowance at 3% of GPR.
Location
Approximate area. The exact address is shared on request.
Similar buildings nearby
| Property | Price | $/unit$/unit vs median | Cap |
|---|---|---|---|
 Houston, TX Stabilized | $699K | $117K$117K | — |
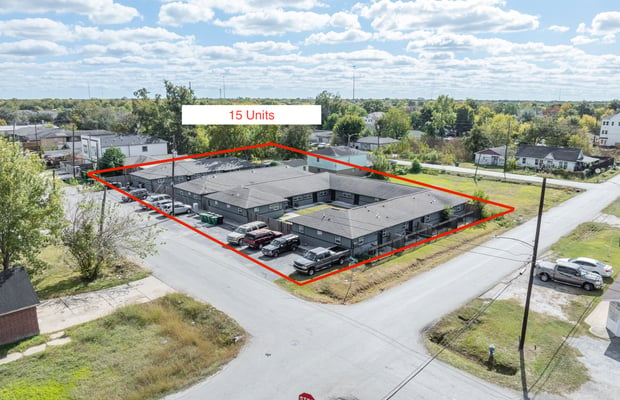 Houston, TX High yieldValue-add | $1.15M | $77K$77K | 8.6% |
 Houston, TX | $550K | $69K$69K | — |
 Houston, TX Stabilized | $570K | $95K$95K | — |
 Houston, TX Value-add | $475K | $40K$40K | — |
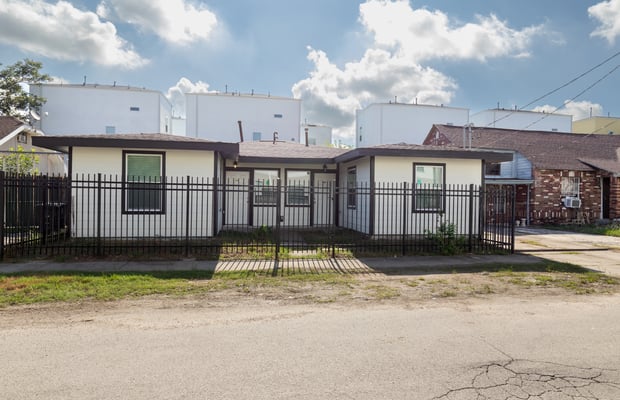 Houston, TX Stabilized | $1.25M | $208K$208K | 6.4% |